Continue reading “Graphic: 2013 Total Defense Spending 860.9B”

The truth at any cost lowers all other costs — curated by former US spy Robert David Steele.

Annoted to add 1% Triangle
See Also:
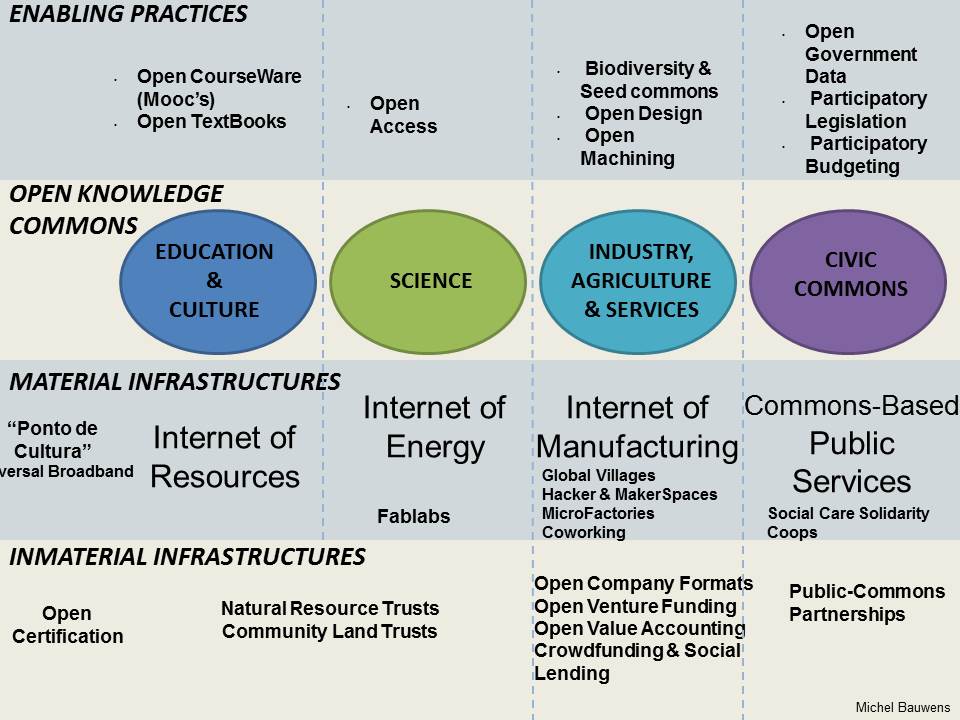
Source: Michel Bauwens: Toward an Open Commons-Based Knowledge Society
– Changing the Productive Matrix of Ecuador
Graphic Artistry by Six-Penny Graphics
Graphic Artistry by Six-Penny Graphics

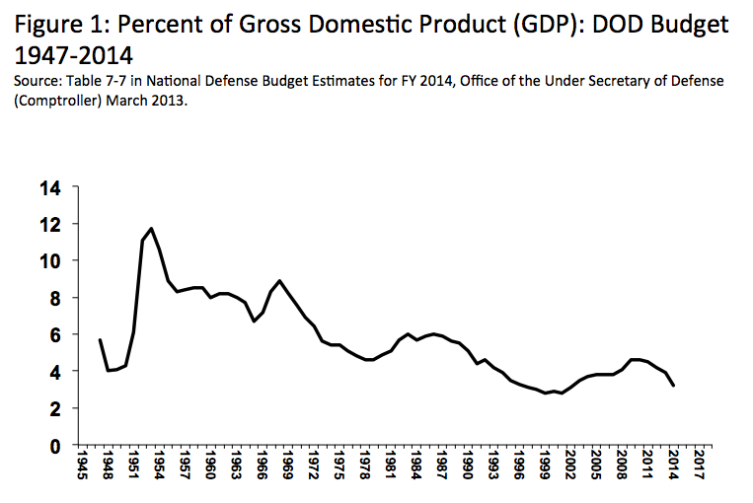
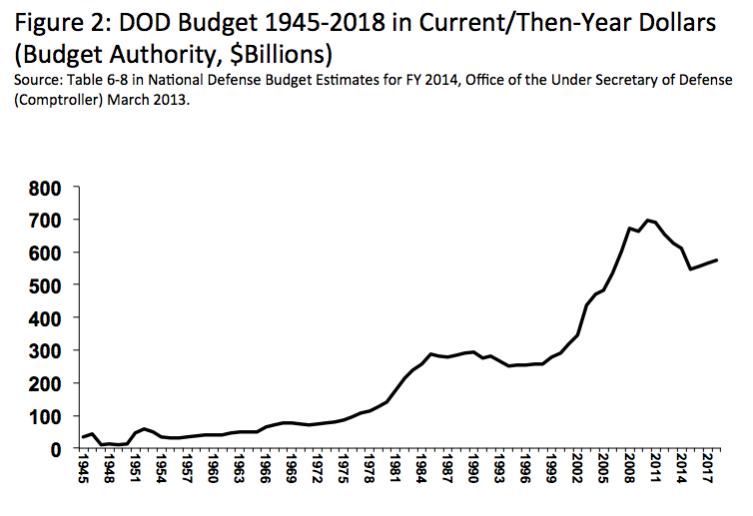
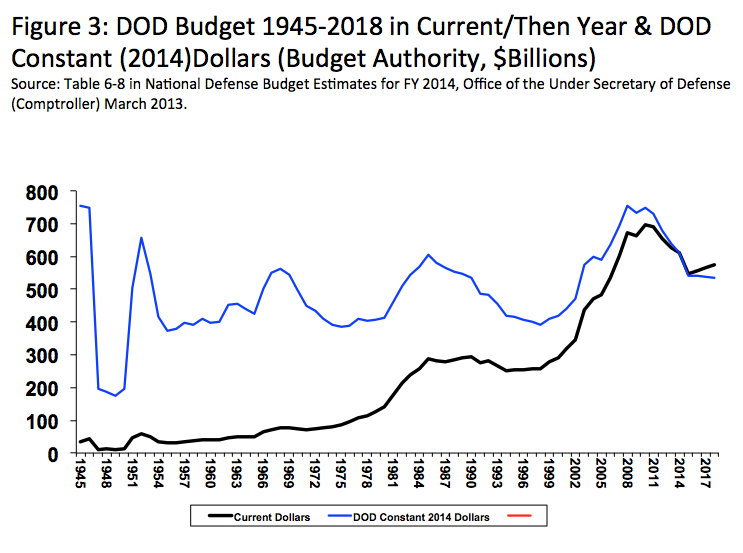
In a two part series (titled “The Defense Budget Is Even Larger than You Think”) at Time magazine's Battleland blog, I attempt to explain how high spending advocates and even the Department of Defense misuse and manipulate budget data to alter public and congressional perceptions of the contemporary size of DOD spending. The differences between what the Pentagon's self-serving data present to the public and what is shown by generally used measures of the American economy amounts to hundreds of billions of dollars in some cases. The generally accepted, non-DOD budget history data I use for this analysis (described in more detail in tomorrow's Part II) put the current defense budget debate and assertions that Pentagon spending is shrinking to “dangerously low” levels in an entirely new perspective.
Part I, “Cooked Books Tell Tall Tales,” describes the subtle, and not so subtle, ways that the Pentagon and other high spending advocates distort DOD's budget history to make the public and Congress think they need to cough up more money. Find this first installment at
The Defense Budget Is Even Larger than You Think: Part one of two.
Graphics Only: