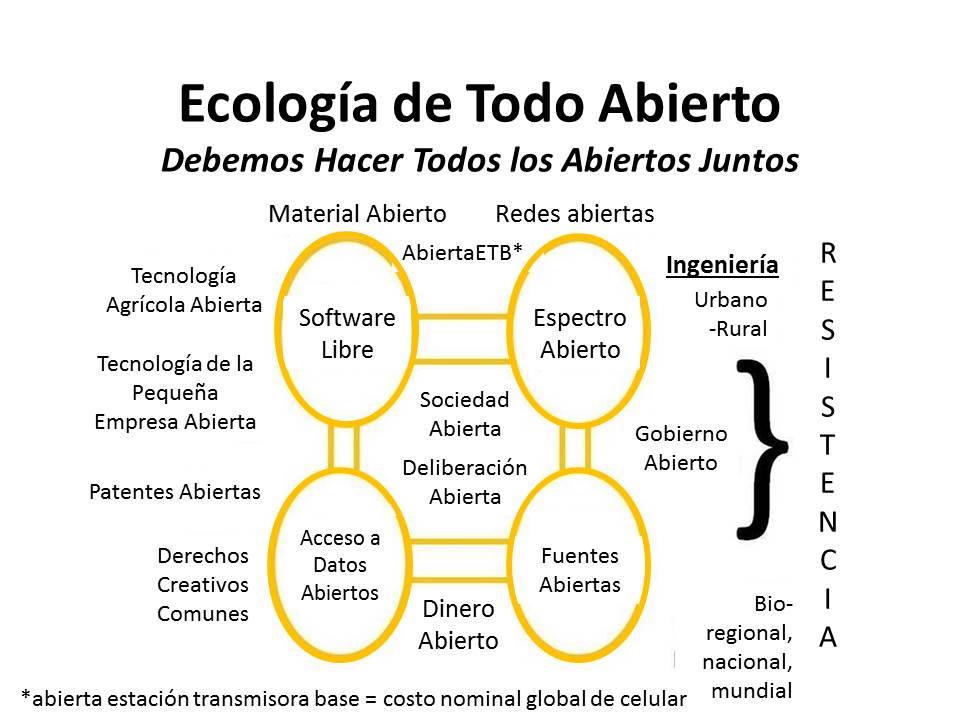
Posted on 2014/12/01Grafico: Ecologia de Todo AbiertoAA Espanol, Capabilities-Force Structure, ICT-IT, Innovation, Processing, True Cost Haga clic en la imagen para ampliarla Fuente
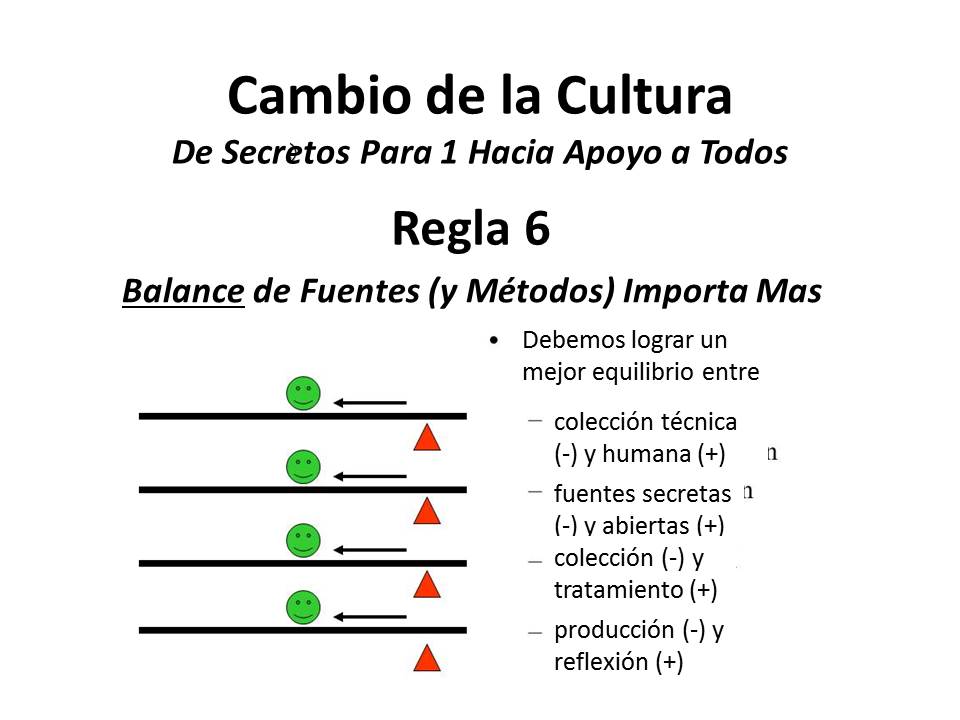
Posted on 2014/12/01Grafico: Cambio de la CulturaAA Espanol, Capabilities-Force Structure, ICT-IT, Processing Haga clic en la imagen para ampliarla Fuente
Posted on 2014/12/01Grafico: La Importancia de Civiles a Los MilitaresAA Espanol, ICT-IT, Leadership-Integrity, Multinational Plus, Tribes Haga clic en la imagen para ampliarla Fuente
Posted on 2014/08/152014/08/16Graphic: Embedded Intelligence — Adding Open Source Everything (Engineering Intelligence), True Cost Economics (Supply Intelligence) and Holistic Analytics (Demand Intelligence)Analysis, Citizen-Centered, Data, Design, Earth Orientation, Economics/True Cost, Education, Governance, Graphics, ICT-IT, Innovation, Innovation, Leadership-Integrity, Manufacturing, Materials, Multinational Plus, Policies-Harmonization, Political, Processing, Reform, Resilience, Resilience, Science, Software, Sources (Info/Intel), Strategy-Holistic Coherence, Tribes, True Cost Enhanced Graphic: Click on Image to Enlarge Source: Robert David Steele Continue reading “Graphic: Embedded Intelligence — Adding Open Source Everything (Engineering Intelligence), True Cost Economics (Supply Intelligence) and Holistic Analytics (Demand Intelligence)”
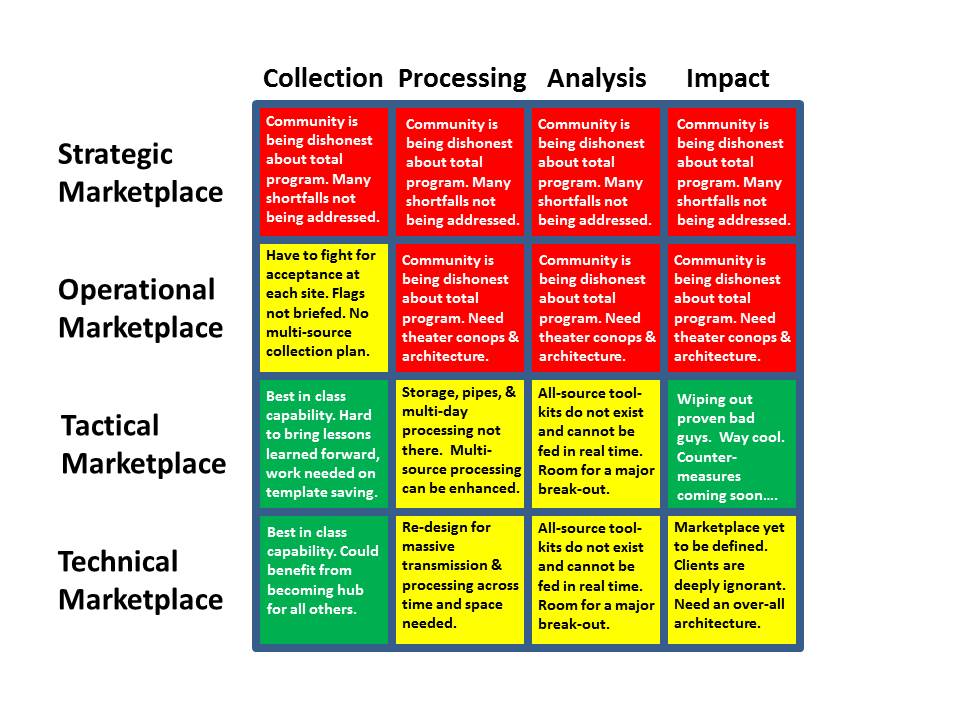
Posted on 2014/05/162014/05/16Graphic: Persistent Surveillance Stoplight ChartAnalysis, Balance, Capabilities-Force Structure, Collection, Corruption, Geospatial, ICT-IT, Processing, Reform, Strategy-Holistic Coherence, Threats, True Cost Click on Image to Enlarge PPT: Single Source Evaluation Matrix 1.2 See Also: Analysis @ Phi Beta Iota Big Data @ Phi Beta Iota Yoda: Exascale by 2020? No Way, Jose! Four Socko Graphics and Bottom Line Upfront — Human Brain Still a Million Times More Power Efficient
Posted on 2014/05/112014/05/11Graphic: OpenEarth Geospatial Data StandardsCollection, Geospatial, ICT-IT, Innovation, Policies-Harmonization, Processing, Strategy-Holistic Coherence, True Cost Click on Image to Enlarge Source
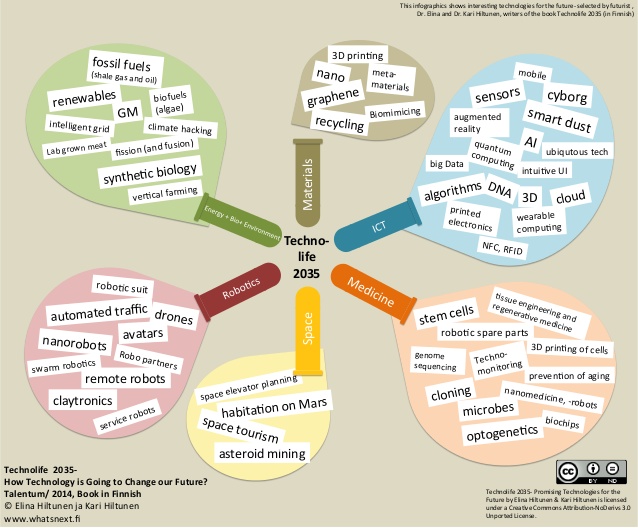
Posted on 2013/11/09Graphic: Interesting Technologies Toward 2015ICT-IT, Innovation Click on Image to Enlarge Source Berto Jongman